 Claude
 Perplexity
Dashboard
The Dashboard gives you an at-a-glance view of all assessments for a selected assessment definition — scores, completion status, account breakdowns, and more.
What you can do here
- View aggregate metrics across all assessments for the selected definition
- Browse and interact with 11 built-in analytics components
- Configure which components are visible and their order
- Download a CSV export of all assessment data
- Open the Pivot Table for flexible cross-sectional analysis
Dashboard Overview
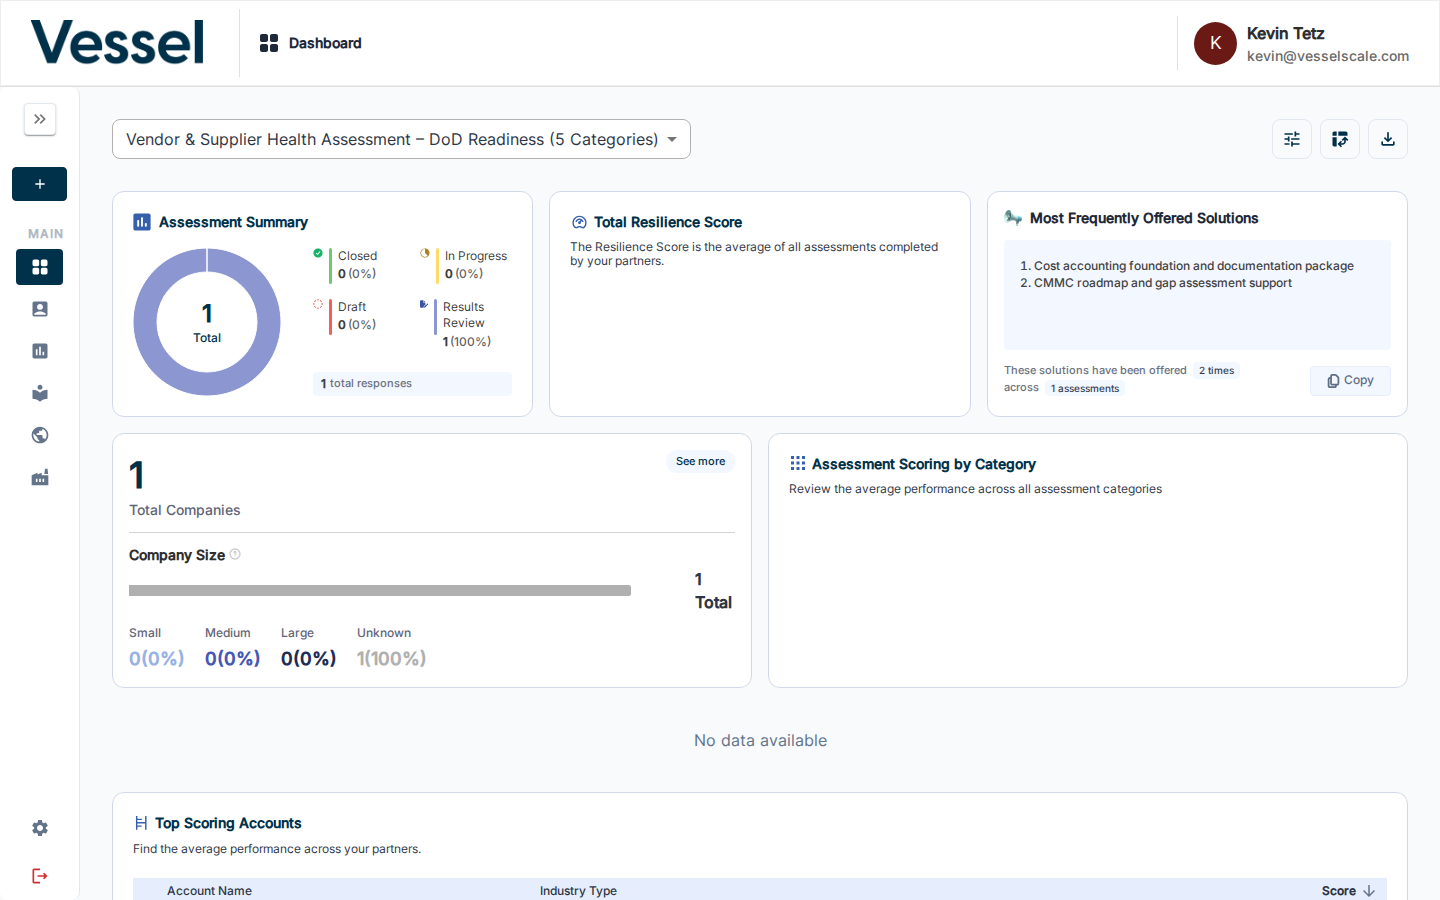
The assessment definition selector at the top of the page controls which assessment's data is displayed across all components. The toolbar in the top-right corner provides quick access to configuration, the pivot table, and CSV download.

| Button | Action |
|---|---|
| Configure (sliders icon) | Open Configure Dashboard to add, remove, or reorder components |
| Pivot Table (grid icon) | Navigate to the Pivot Table for tabular analysis |
| Download CSV (download icon) | Download all assessment data as a CSV file |
Components
The dashboard displays up to 11 analytics components. See Components for a description and screenshot of each one.
Related
- Getting Started: Step 7 — Quick-start guide to the dashboard
- Components
- Configure Dashboard
- Download CSV
- Pivot Table
- Assessments