 Claude
 Perplexity
Assessment Scoring
Assessment scores are calculated from respondent answers and displayed using one of two scoring methods — Averaged (the default) or Summed. Understanding how each method works helps you design assessments that communicate results clearly.
How Scoring Works
When respondents complete an assessment:
- Question responses are scored based on selected answers or numeric values
- Category scores are calculated from all questions in that category
- Overall assessment score is computed from all category scores
- Results are displayed using the configured scoring method
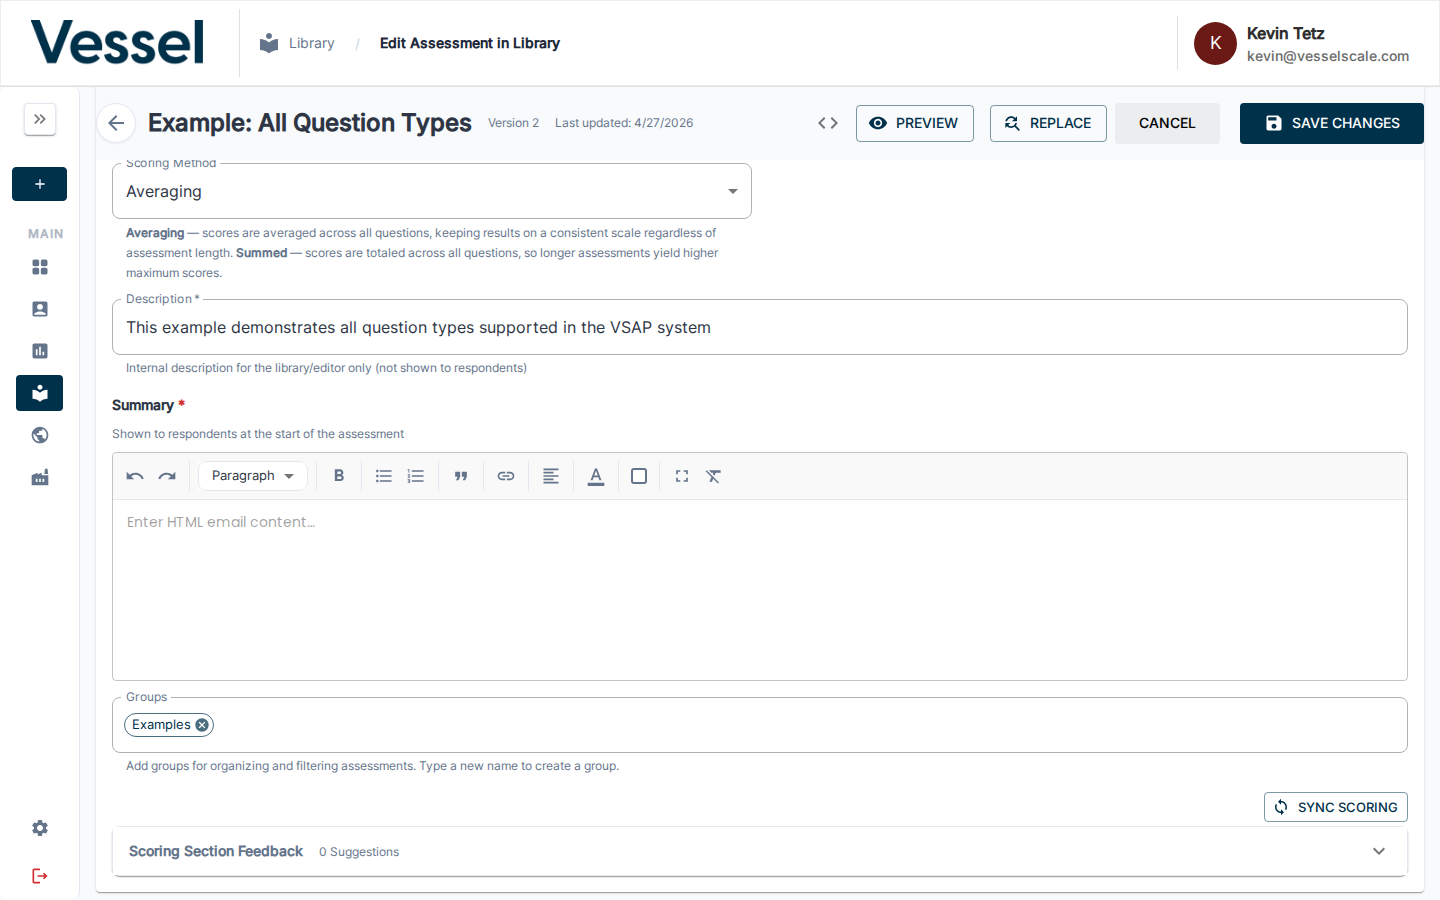
Scoring Method
The Scoring Method field is in the Assessment Details section of the library editor.
| Method | Description |
|---|---|
| Averaging (default) | Scores are averaged across all questions, keeping results on a consistent scale regardless of assessment length |
| Summed | Scores are totaled across all questions, so longer assessments yield higher maximum scores |
Averaged Scoring (Default)
With Averaging, every question's score contributes equally, and the final result stays within the same range regardless of how many questions are in the assessment.
$$\text{Averaged Score} = \frac{\text{Sum of All Question Scores}}{\text{Number of Questions}}$$
Key Characteristics
- Consistent scale: Score range stays the same no matter how many questions the assessment has
- Easy comparison: Assessments with different lengths can be compared directly
- Intuitive: A score of 4.2 means the same thing across all assessments
Example: Averaged Scoring
Assessment with 10 questions, each worth 0–5 points
| Item | Value |
|---|---|
| Total score earned | 35 points |
| Number of questions | 10 |
| Averaged score | 35 ÷ 10 = 3.5 |
Comparing two assessments of different lengths:
| Assessment | Score Earned | Questions | Averaged Score |
|---|---|---|---|
| Assessment A | 20 pts | 5 questions | 4.0 |
| Assessment B | 40 pts | 10 questions | 4.0 |
Both show 4.0 — directly comparable despite different lengths.
Summed Scoring
With Summed scoring, every question's score is added together. The maximum possible score scales with the number of questions.
$$\text{Summed Score} = \sum \text{All Question Scores}$$
Key Characteristics
- Raw total: Shows the actual accumulated points across all questions
- Length-dependent: Maximum score varies based on number of questions
- Detailed analysis: Useful when absolute point totals are meaningful
Example: Summed Scoring
Assessment with 10 questions, each worth 0–5 points
| Item | Value |
|---|---|
| Total possible score | 50 points |
| Score earned | 35 points |
| Summed score | 35 out of 50 |
Comparing two assessments of different lengths:
| Assessment | Score Earned | Max Possible | Summed Score |
|---|---|---|---|
| Assessment A | 20 pts | 25 pts | 20/25 |
| Assessment B | 40 pts | 50 pts | 40/50 |
The raw totals differ — you must account for different maximums when comparing.
Choosing the Right Method
| Use Case | Recommended Method |
|---|---|
| Comparing across assessments of different lengths | Averaged |
| Standard benchmarking or industry comparisons | Averaged |
| Point-accumulation models (longer = more points) | Summed |
| When absolute totals matter to your analysis | Summed |
When in doubt, use Averaging
Averaging is the default for good reason — it keeps scores consistent and comparable regardless of how you grow or change your assessment over time.
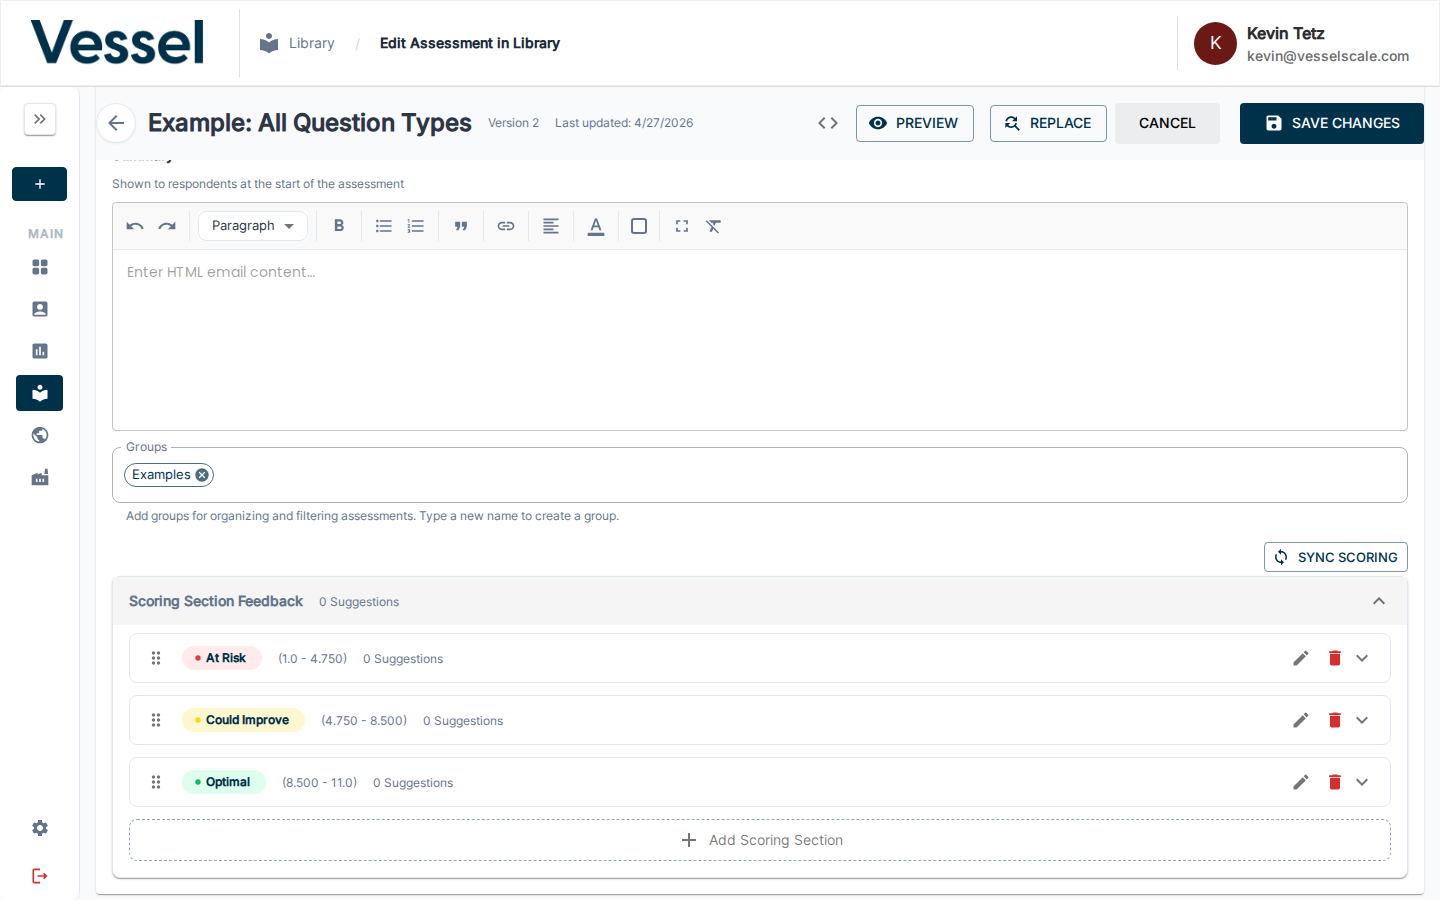
Scoring Section Feedback
The Scoring Section Feedback accordion in Assessment Details lets you define named score ranges (sections) that appear on the respondent's results page with tailored feedback.
Each section defines:
- Section name (e.g., At Risk, Could Improve, Optimal)
- Score range (Min Score – Max Score)
- Color theme for the results display
- Suggestions (strengths, root causes, solutions, recommended actions)
Sync Scoring
SYNC SCORING automatically recalculates and evenly distributes the score range thresholds across all of your scoring sections based on the current assessment configuration.

Use it whenever you:
- Add or remove questions that change the total possible score
- Add or remove scoring sections
- Change the Scoring Method between Averaged and Summed
- Want to reset thresholds to an even distribution after manual edits
Tip
Always click SYNC SCORING after making structural changes to your assessment (adding categories, questions, or sections) to keep thresholds accurate.
Editing a Scoring Section
Click the pencil icon (✏) on any scoring section row to open the section editor.
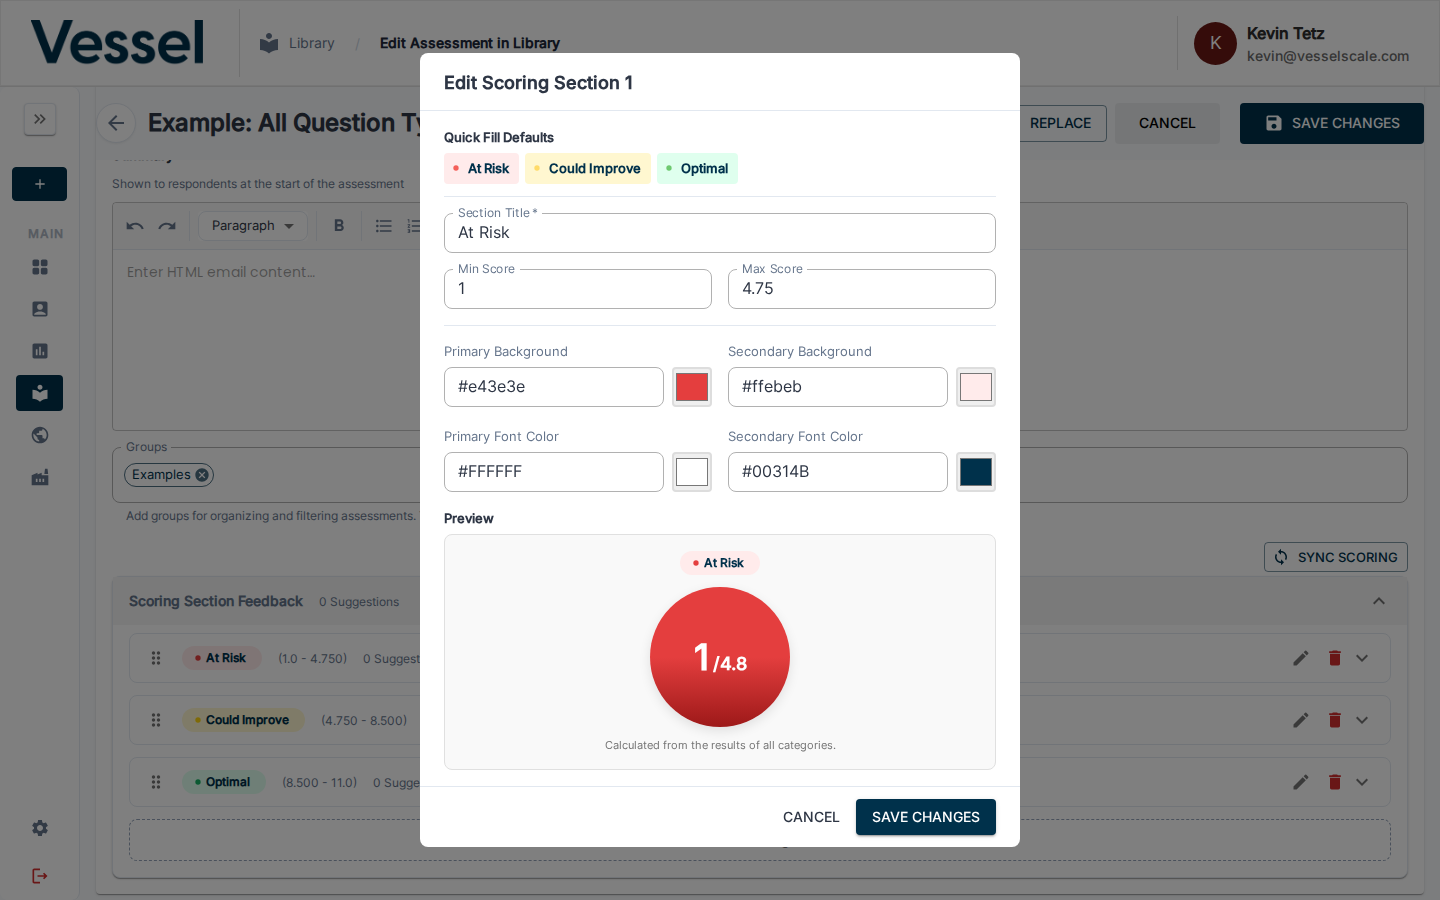
The editor includes:
| Field | Description |
|---|---|
| Section Title | Name displayed on the results page (e.g., "At Risk") |
| Min Score | Lower bound of this score range |
| Max Score | Upper bound of this score range |
| Primary Background | Background color for the section badge |
| Secondary Background | Background color for score detail areas |
| Primary Font Color | Text color on the badge |
| Secondary Font Color | Text color on score detail areas |
| Preview | Live visualization showing how the section will appear to respondents |
Use Quick Fill Defaults at the top of the modal to instantly apply the standard At Risk / Could Improve / Optimal color presets.
How Scores Are Calculated
Step 1: Question Scoring
Each question is scored based on the respondent's answer:
Multiple Choice & Multiple Select - Selected option's score value is assigned - Example: Select "Strongly Agree" (score=5) on a Likert question
Numeric Questions - The numeric value entered is the score - Example: Enter "85" for "What percent of orders are on-time?"
Numeric Range Questions - The numeric value is matched to a range, and that range's score is assigned - Example: Enter "10" employees → matched to "1-20" range → score of 2
Text Questions - Text questions are not scored (score = 0) - Used for qualitative feedback only
Step 2: Category Scoring
All question scores within a category are summed:
$$\text{Category Score} = \sum \text{All Question Scores in Category}$$
Step 3: Overall Assessment Score
Depending on the Scoring Method:
Averaged:
$$\text{Overall Score} = \frac{\sum \text{All Category Scores}}{\text{Total Number of Scorable Questions}}$$
Summed:
$$\text{Overall Score} = \sum \text{All Category Scores}$$
Normalized Scoring (Percentile Ranges)
Normalized scoring converts raw assessment scores into percentiles, displaying results as a percentage of the available score range (0–100%). This approach makes scores intuitive and comparable, regardless of the underlying assessment structure.
What is Normalized Scoring?
Normalized scoring expresses a respondent's score as a percentage of the maximum possible score:
$$\text{Normalized Score (\%)} = \frac{\text{Actual Score} - \text{Min Possible Score}}{\text{Max Possible Score} - \text{Min Possible Score}} \times 100$$
This converts any score into a 0–100 percentile range, making interpretation consistent across all assessments.
Example: Normalized Score Calculation
Scenario: Assessment with min score 0, max score 50, respondent scores 37.5
$$\text{Normalized Score} = \frac{37.5 - 0}{50 - 0} \times 100 = \frac{37.5}{50} \times 100 = 75\%$$
A respondent who scores 37.5 out of 50 gets a 75% normalized score — placing them in the upper performance tier.
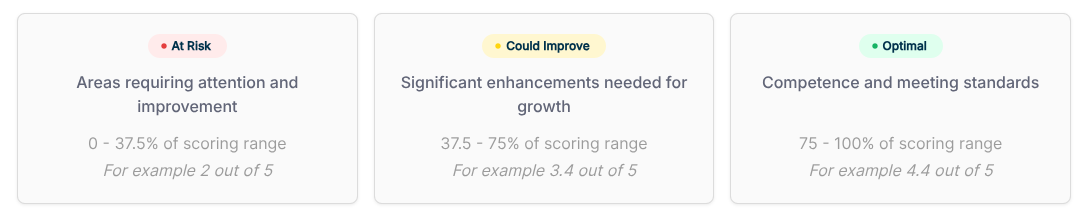
Percentile Score Ranges
Normalized scores are typically divided into three to five performance tiers. The standard configuration uses three tiers:
| Tier | Range | Interpretation |
|---|---|---|
| At Risk | 0–37.5% | Areas requiring attention and improvement |
| Could Improve | 37.5–75% | Significant enhancements needed for growth |
| Optimal | 75–100% | Competence and meeting standards |
How Normalized Scores Map to Scoring Sections
When you define Scoring Section Feedback in your assessment, the platform automatically maps respondent scores to these percentile ranges:
- Raw score is calculated from respondent answers (using your Averaged or Summed method)
- Score is normalized to a 0–100 percentile using the min/max score range
- Percentile is matched to a scoring section tier (At Risk, Could Improve, Optimal, etc.)
- Feedback is displayed with the corresponding tier name, color, and suggestions
Example: End-to-End Scoring Flow
| Step | Calculation | Result |
|---|---|---|
| 1. Raw score | Questions scored and summed | 34 out of 50 points |
| 2. Normalize | (34 - 0) / (50 - 0) × 100 | 68% percentile |
| 3. Tier match | 68% falls in 37.5–75% range | Matches "Could Improve" section |
| 4. Display | Show "Could Improve" feedback with yellow color | Respondent sees recommendations for growth |
Key Advantages of Normalized Scoring
- Consistent interpretation: A 75% score means the same thing across all assessments
- Easy comparison: Compare respondents or assessments even with different lengths
- Intuitive results: Percentages are universally understood (0% = lowest, 100% = highest)
- Flexible tier definitions: You can customize tier ranges and names to match your assessment goals
- Color-coded feedback: Each tier has its own color and feedback content for visual clarity
Customizing Percentile Ranges
You can customize the tier ranges and names to fit your assessment. Common alternatives to the standard three-tier system include:
Four-tier system: - Below Expectations: 0–25% - Developing: 25–50% - Proficient: 50–75% - Advanced: 75–100%
Five-tier system: - Critical: 0–20% - Below Target: 20–40% - Target: 40–60% - Above Target: 60–80% - Excellent: 80–100%
To customize ranges, edit each Scoring Section in Assessment Details and set the Min Score and Max Score to define where each tier begins and ends.
Common Scenarios
Scenario 1: Different Assessment Lengths, Same Score Meaning
| Assessment | Score Earned | Max Possible | Normalized | Tier |
|---|---|---|---|---|
| Quick Survey (5 questions) | 3.75 | 5 | 75% | Optimal |
| Full Assessment (20 questions) | 15 | 20 | 75% | Optimal |
Both respondents show 75% — Optimal performance — even though the raw scores differ.
Scenario 2: Tracking Progress Over Time
A respondent completes an assessment and scores 60% (Could Improve). After training, they retake the assessment and score 82% (Optimal). The normalized percentiles make progress immediately clear.