 Claude
 Perplexity
Pivot Table
The Pivot Table lets you explore all assessment response data for a selected assessment definition in a flexible tabular format. You choose which columns to include, then load the data for sorting, filtering, and export.
What you can do here
- Select which assessment data and account data columns to include
- View all response records in a scrollable data grid
- Switch between Grid, Pivot, and Chart view modes
- Adjust row size (S / M / L)
- Export the current view
Opening the Pivot Table
Click the Pivot Table button (grid icon) in the top-right toolbar of the dashboard. You can return to the dashboard at any time with the Back to Dashboard button.
Column Selector
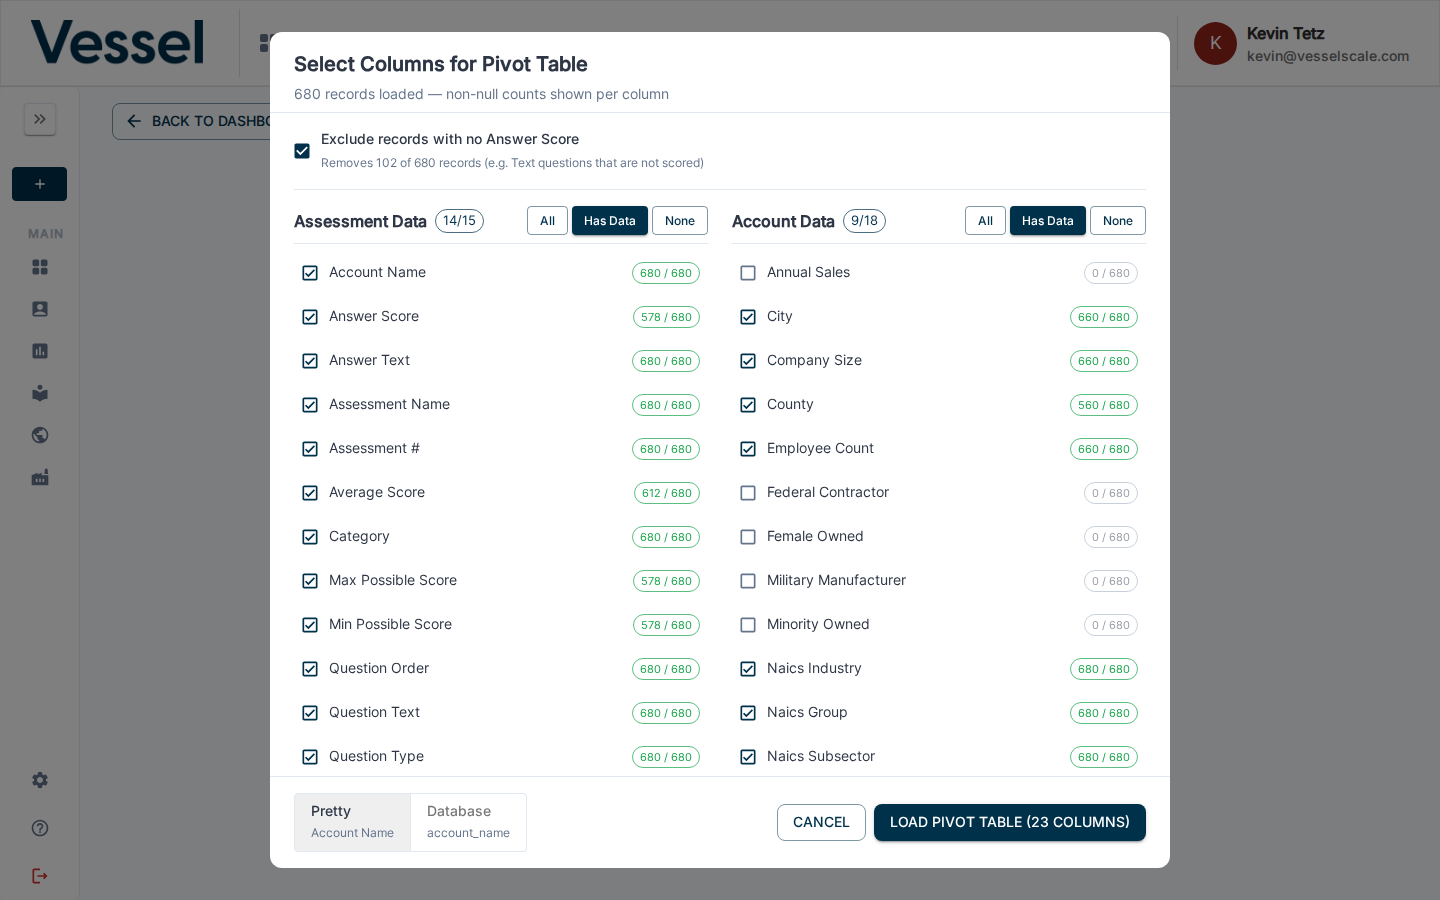
When the pivot table opens, a column selector dialog appears. It is divided into two groups:
- Assessment Data — question-level fields such as Account Name, Answer Score, Answer Text, Assessment Name, Category, Question Text, and more
- Account Data — account attributes such as City, Company Size, NAICS Industry, Employee Count, Federal Contractor status, and more
Each column shows a count of non-null values (e.g. 50 / 50). Use the All, Has Data, or None toggles to quickly select or deselect columns within a group.
The Exclude records with no Answer Score checkbox (checked by default) filters out text-type questions that are not scored.
Click Load Pivot Table to fetch the data with your selected columns.
Data Grid
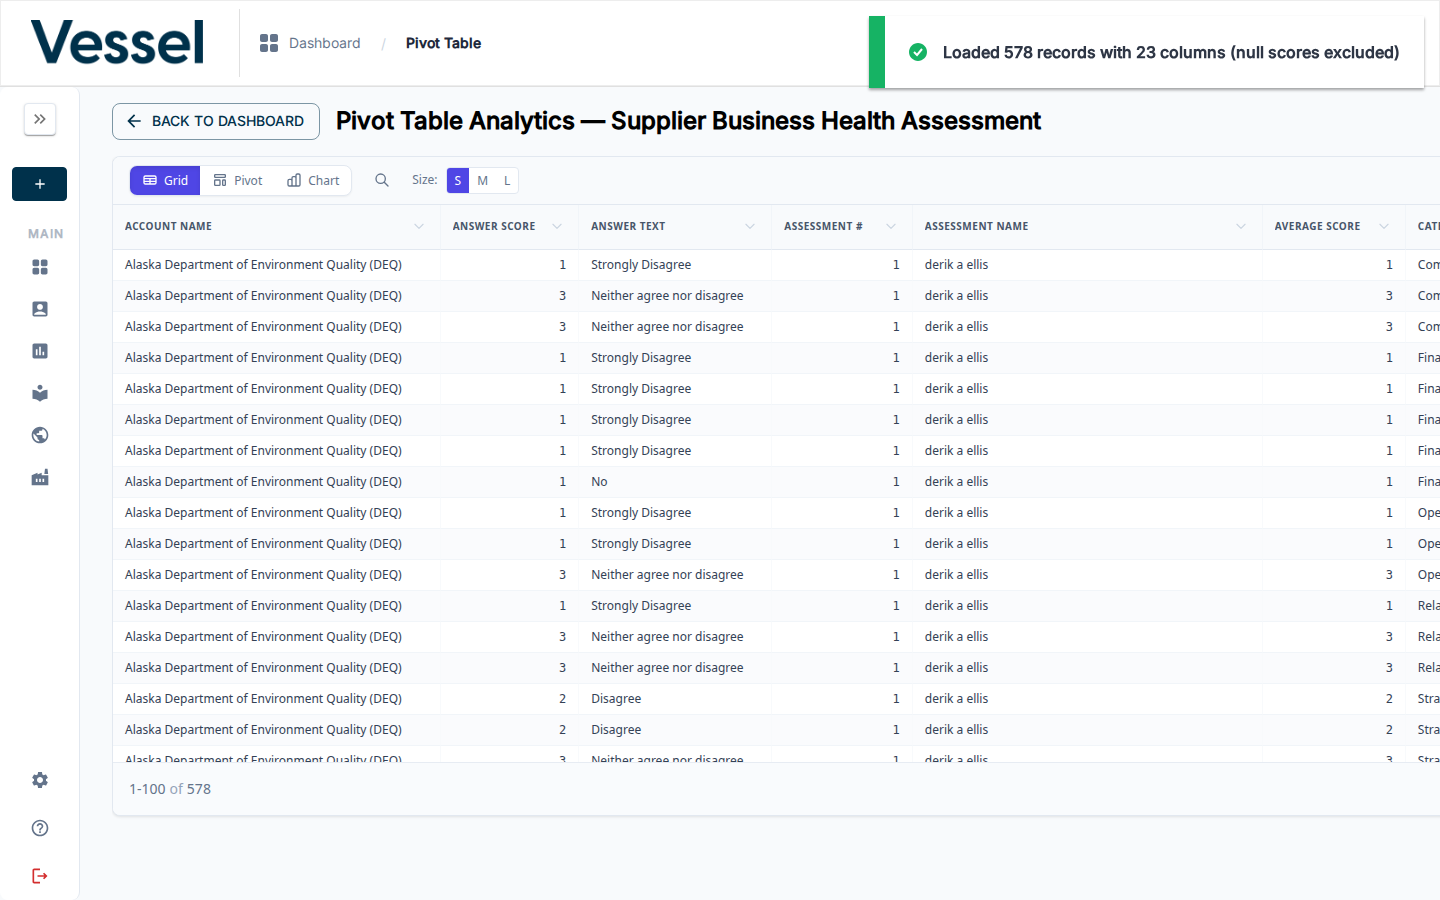
The grid displays one row per question response. Columns are sortable. The header shows the total records loaded and the number of columns selected.
Use the Columns button in the top-right of the grid to show or hide columns without going back to the column selector.
Related
- Download CSV — export all data without column selection
- Dashboard Overview