 Claude
 Perplexity
Report Builder
The Report Builder is where you analyze assessment results and document your findings. It is accessible from the Assessment Details page once the assessment has received at least one response.
Opening the Report Builder
From the Assessment Details page, click Build Report in the top action bar.
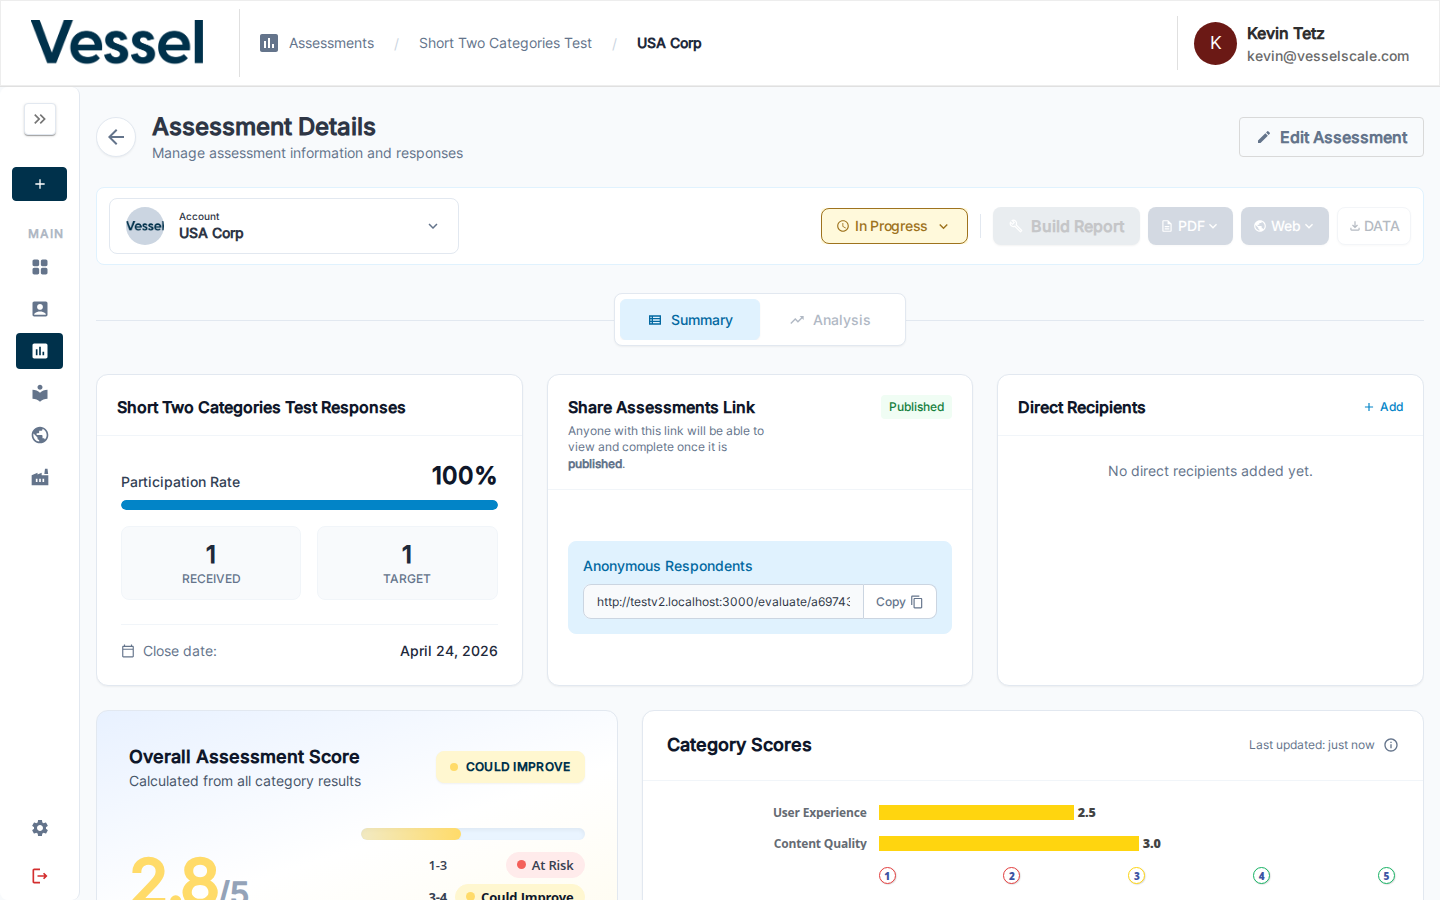
Note
The Build Report button is only active when the assessment has received responses. If the button appears grayed out, ensure the assessment is published and that respondents have submitted their answers.
Report Builder Layout
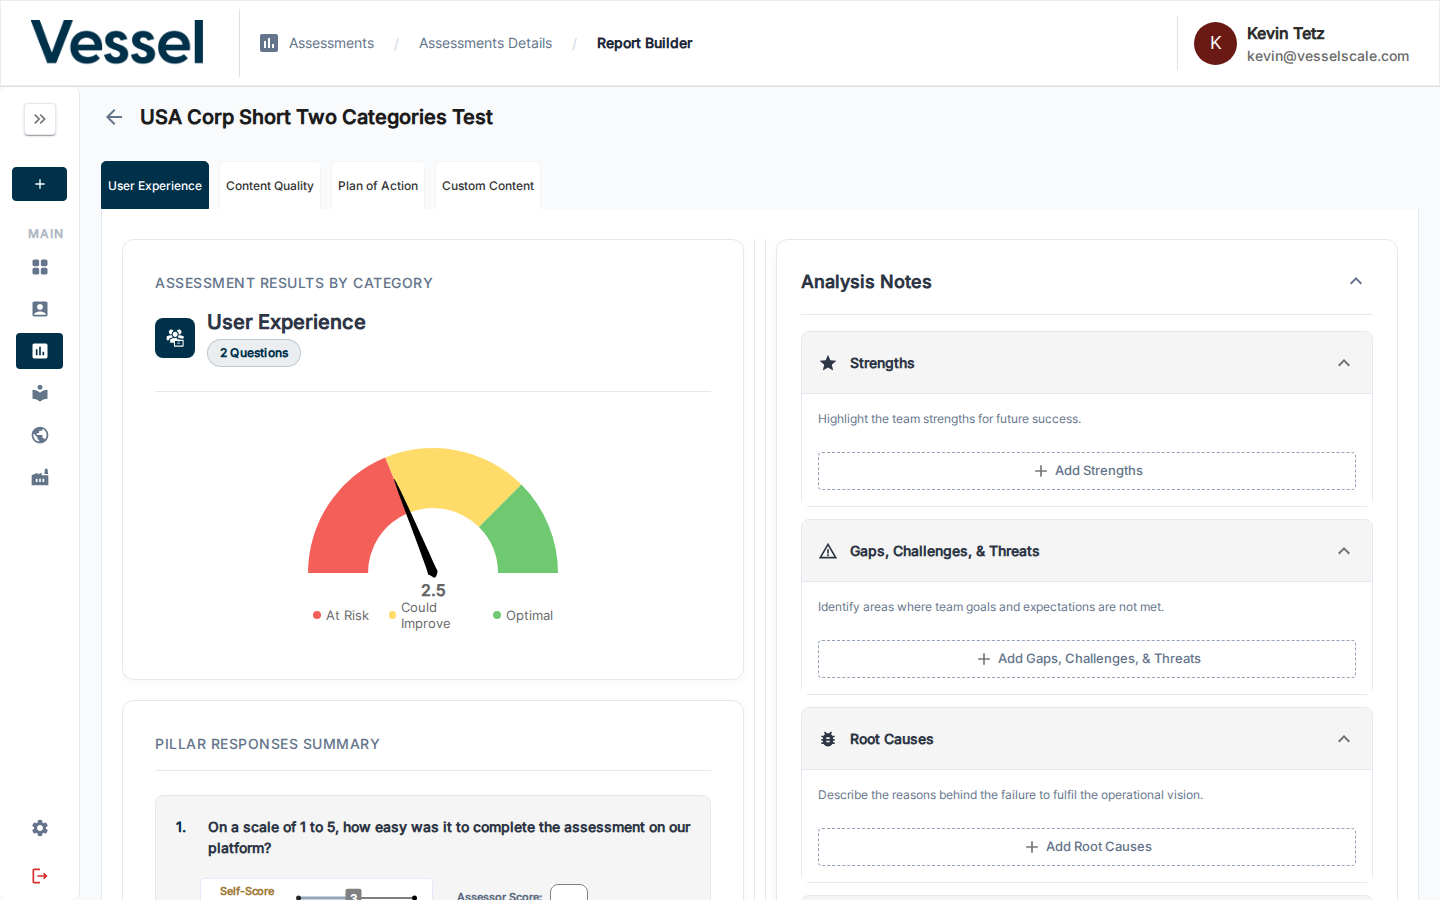
The Report Builder is divided into two main panels:
Left Panel — Assessment Results
Category Tabs at the top let you switch between the assessment's categories (e.g., User Experience, Content Quality, Plan of Action). Each tab shows:
| Section | Description |
|---|---|
| Assessment Results by Category | A gauge chart showing the category's average score and zone (At Risk / Could Improve / Optimal) |
| Pillar Responses Summary | A breakdown of each question in the category, with the respondent's self-score alongside the assessor's score |
Right Panel — Analysis Notes
The Analysis Notes panel is where you record your professional analysis for each category. There are five structured sections:
| Section | Purpose |
|---|---|
| Strengths | Highlight what the team is doing well |
| Gaps, Challenges, & Threats | Identify areas where goals and expectations are not being met |
| Root Causes | Describe the underlying reasons for any failures or shortfalls |
| Qualitative Insights | AI-generated summary of open-ended question responses — review and edit as needed |
| Plan of Action | Outline recommended next steps |
Click + Add [Section] to expand a section and enter your notes. Notes are saved per category — switch between category tabs to add analysis for each.
Qualitative Insights
The Qualitative Insights section surfaces an AI-generated summary of all open-ended question responses for a category, giving you a quick starting point for your narrative analysis.
How It Works
- When you open a category in the Report Builder, the Qualitative Insights section shows a summary automatically generated from respondents' free-text answers.
- Review the generated content — it reflects themes and patterns across all open-ended responses for that category.
- Click into the text to edit, expand, or refine the content before including it in a report.
- Saved changes persist as part of the category's analysis notes.
Tip
Qualitative Insights is a starting point, not a finished product. Review the AI-generated summary for accuracy and add your own professional interpretation before publishing.
Viewing in the Web Report
When a Web Report is published, Qualitative Insights appears as an expandable accordion section in the Analysis Notes area of each category — clearly labeled and distinct from the quantitative score sections.
Customizing the Tab Name
The label "Qualitative Insights" can be renamed in Settings → Branding under the Report Builder Customization section. See Branding — Report Builder Customization for details.
Score Zones
Scores are automatically mapped to one of three zones based on the assessment's scoring configuration:
| Zone | Meaning |
|---|---|
| At Risk | Performance is significantly below expectations |
| Could Improve | Performance is below optimal but showing potential |
| Optimal | Performance meets or exceeds expectations |
Exporting Results
Once your analysis is complete, return to the Assessment Details page to export or publish:
- PDF — Generate a formatted PDF report. See PDF Reports.
- Web — Publish findings as a shareable web report. See Web Reports.
Related
- Getting Started: Step 5 — Quick-start guide to analyzing results
- Assessment Details — Full assessment management
- Assessment Scoring — Score calculation reference
- PDF Reports — Export as PDF
- Web Reports — Publish shareable reports